I am Mariia, a Data Engineer in the Data Product team at FELD M. In April 2023, my colleague and I visited Berlin to attend the famous PyCon – the largest European convention for the discussion and promotion of the Python programming language. Every year it gathers Python users and enthusiasts from all over the world and gives them a platform to share information about new developments, exchange knowledge, and learn best practices from each other. 

In 2023, PyCon Berlin was merged with PyData, a forum of users and developers of data analysis tools. It lasted for three days and included so many presentations that it would take a team of at least seven people to attend all of them. Fortunately, the sessions were recorded, and now, after some months, they are available for everyone. You will find a link to the YouTube playlist of PyCon Berlin 2023 talks at the end of this article. 

But first, I would like to offer you my own overview of the presentations that we attended and liked the most. Please remember that this overview is based on personal opinion, so it may be biased and different from yours. Feel free to add your perspective in the comments! 

1. Pandas 2.0 and beyond 

For whom: Software and Data Engineers, Data Scientists, and everyone who works with Pandas (except animal keepers in public zoos, maybe) 

Why it’s worth watching: The talk not only covers the changes that were implemented in Pandas 2.0 in comparison with Pandas 1.0, but also touches on the topic of PyArrow which is actively used in the latest version of Pandas. (If you are curious what PyArrow is, there is a link to the talk about it at the end of this list). 

Our verdict: Interesting topic, very relevant for our work, Rating: 9/10 

Details: https://pretalx.com/pyconde-pydata-berlin-2023/talk/DB3KC7/ 

Video: https://www.youtube.com/watch?v=7QQZ1hrHG1s&list=PLGVZCDnMOq0peDguAzds7kVmBr8avp46K 

2. Large Scale Feature Engineering and Data Science with Python & Snowflake 

For whom: Data Scientists, Data Engineers, and those who are interested in Snowflake 

Why it’s worth watching: This talk was essentially an introduction to Snowpark, Snowflake’s framework for machine learning development that can work with big data in Python, Scala, or Java. 

Our verdict: Good presentation, but you wouldn’t get too much out of it if you don’t work with Snowflake on a regular basis. Rating: 7/10 

Details: https://pretalx.com/pyconde-pydata-berlin-2023/talk/3TYND7/ 

Video: https://www.youtube.com/watch?v=mpY7auHK3zw&list=PLGVZCDnMOq0peDguAzds7kVmBr8avp46K 

3. Raised by Pandas, striving for more: An opinionated introduction to Polars 

For whom: Software and Data Engineers, Data Scientists, and everyone who works with Pandas (but is striving for more) 

Why it’s worth watching: The talk gives a really good overview of Polars and inspires you to test it as a more powerful alternative to Pandas. 

Our verdict: The speaker was passionate about the framework and a very engaging speaker. The slides were great fun! Above all, the topic of Polars is quite hot at the moment, so definitely: Rating: 10/10 

Details: https://pretalx.com/pyconde-pydata-berlin-2023/talk/Z8PESY/ 

Video: https://www.youtube.com/watch?v=7xcUvzERwx0&list=PLGVZCDnMOq0peDguAzds7kVmBr8avp46K 

4. Common issues with Time Series data and how to solve them  

For whom: mostly Data Scientists, but still relevant for anyone working with data  

Why it’s worth watching:This talk walks you through four common issues with Time Series data and gives you hints on how to resolve them.  

Our verdict: The presentation was quite good, but covered relatively basic things, hence: Rating: 7/10 

Details: https://pretalx.com/pyconde-pydata-berlin-2023/talk/ZRAFKA/ 

Video: https://www.youtube.com/watch?v=sSF1uzK6DuI&list=PLGVZCDnMOq0peDguAzds7kVmBr8avp46K 

5. WALD: A Modern & Sustainable Analytics Stack  

For whom: Data Engineers, BI specialists, and companies and teams who aim to become more data-driven  

Why it’s worth watching: The presentation was dedicated to the tools you can use for building a modern reporting pipeline, and WALD, a solution in which these tools are already combined.  

Our verdict: We were really curious to check out which technologies our colleagues from other companies use for building reporting pipelines. Also, I have to admit, the slides were very cool! Rating: 8/10  

Details: https://pretalx.com/pyconde-pydata-berlin-2023/talk/TP7ABB/  

Video: https://www.youtube.com/watch?v=7GfbA6_a09I&list=PLGVZCDnMOq0peDguAzds7kVmBr8avp46K 

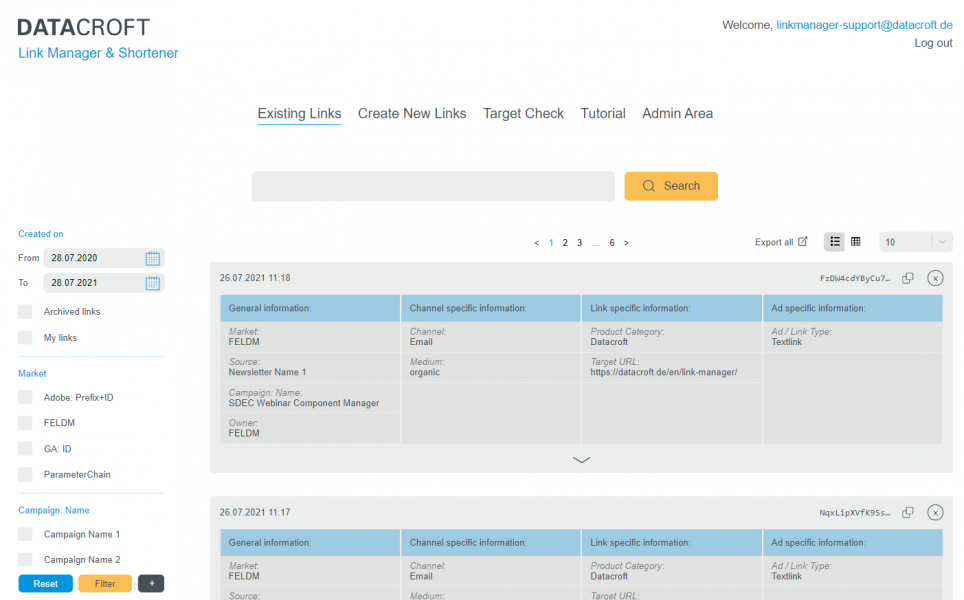
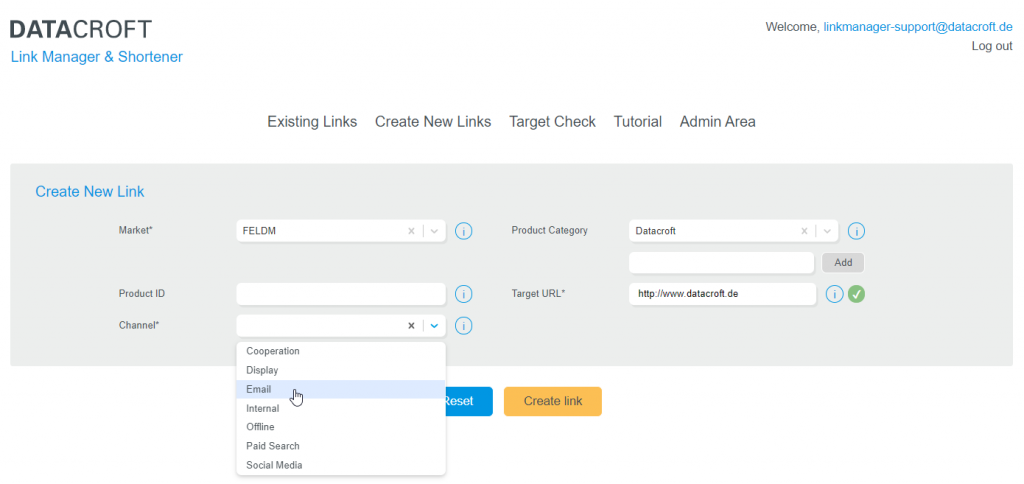
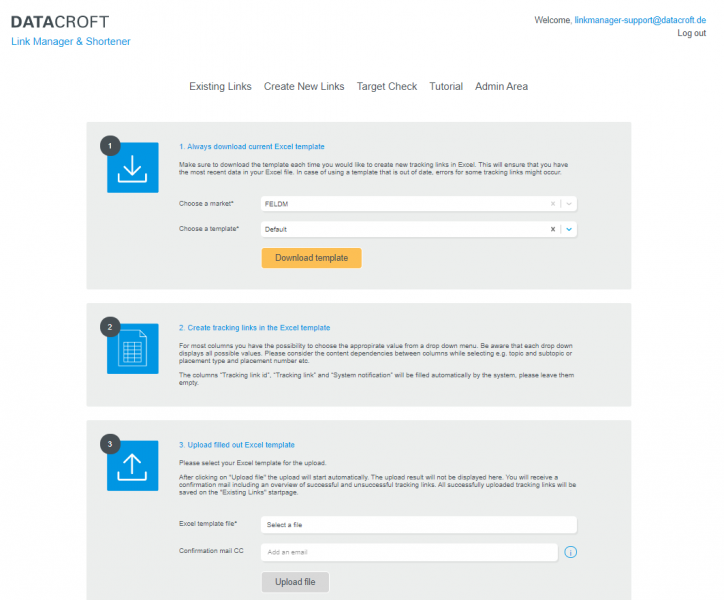
If you are looking for a ready-to-use solution that would help you extract more value from your data, check out the development of our Data Product team: Datacroft Analytics Stack and contact us for more details! 

6. Towards Learned Database Systems 

For whom: Anyone working with databases 

Why it’s worth watching: It’s a presentation of the new direction of so-called Learned Database Management Systems (DBMS) where core parts of DBMS are being replaced by machine learning models, which has shown significant performance benefits. 

Our verdict: The topic is exciting per se, but kudos to the speaker – he made it even better with his excellent and well-balanced presentation! Rating: 10/10 

Details: https://pretalx.com/pyconde-pydata-berlin-2023/talk/JZSYA3/ 

Video: https://www.youtube.com/watch?v=VtL6Y4x10O0&list=PLGVZCDnMOq0peDguAzds7kVmBr8avp46K 

7. Rusty Python: A Case Study

For whom: Software and Data Engineers working with Python  

Why it’s worth watching: An overview of Rust and its benefits for Python developers. Exciting presentation about implementing a solution in Rust and integrating it with a Python application using PyO3.  

Our verdict: Very interesting topic and excellent presentation, Rating: 10/10  

Details: https://pretalx.com/pyconde-pydata-berlin-2023/talk/LMGF8V/  

Video: https://www.youtube.com/watch?v=Y5XQR0wUEyM&list=PLGVZCDnMOq0peDguAzds7kVmBr8avp46K 

8. Lorem ipsum dolor sit amet  

For whom: Everyone working with software and data 

Why it’s worth watching: The talk is dedicated to the process of finding meaningful test data for your software. The importance of this topic can’t be over-estimated, so those who work with data on a regular basis should definitely check it out. 

Our verdict: Fun slides, but I’ve got a feeling that the main message was a bit diluted by the amount of jokes and examples. Still, it was a useful and engaging session. Rating: 8/10 

Details: https://pretalx.com/pyconde-pydata-berlin-2023/talk/HJ9J7Z/ 

Video: https://www.youtube.com/watch?v=ulBqrMyVSMM&list=PLGVZCDnMOq0peDguAzds7kVmBr8avp46K 

9. Unlocking Information – Creating Synthetic Data for Open Access  

For whom: Data Scientists, but might be interesting to anyone working with data  

Why it’s worth watching: If you’ve ever wondered how to make the data you used in your work public without disclosing any personal information, this presentation might be exactly what you are looking for. 

Our verdict: The topic is a bit niche, though still good for general professional development. Rating: 7/10 

Details: https://pretalx.com/pyconde-pydata-berlin-2023/talk/J9KRKZ/ 

Video: https://www.youtube.com/watch?v=N1i_Z-WKaRs&list=PLGVZCDnMOq0peDguAzds7kVmBr8avp46K

10. Most of you don’t need Spark. Large-scale data management on a budget with Python  

For whom: Software and Data Engineers, Data Scientists  

Why it’s worth watching: The talk covered a lot of aspects and technologies that can help you manage large volumes of data and build scalable infrastructure for its processing. 

Our verdict: The speaker asks some questions that might make you feel a bit dumb and trigger an episode of impostor syndrome, but besides that the talk was great! Rating: 9/10 

Details: https://pretalx.com/pyconde-pydata-berlin-2023/talk/V9HBUU/ 

Video: https://www.youtube.com/watch?v=OsYcsv4VkO8&list=PLGVZCDnMOq0peDguAzds7kVmBr8avp46K 

11. Apache Arrow: connecting and accelerating dataframe libraries across the PyData ecosystem  

For whom: Software and Data Engineers, Data Scientists  

Why it’s worth watching: If you have heard about PyArrow or Apache Arrow before (e.g., while watching the “Pandas 2.0 and beyond” talk) and you want to dive deeper and find out more about this technology, this presentation is for you. If you haven’t heard of PyArrow before, this presentation is even more perfect for you.  

Our verdict: Arrow is fantastic, but the talk was not too light-hearted, so it requires some concentration. Rating: 8/10  

Details: https://pretalx.com/pyconde-pydata-berlin-2023/talk/H7ZCWK/  

Video: https://www.youtube.com/watch?v=h7F3Rr8Ozgw&list=PLGVZCDnMOq0peDguAzds7kVmBr8avp46K 

12. Postmodern Architecture – The Python Powered Modern Data Stack 

For whom: Data Engineers, BI specialists, companies and teams who aim to become more data-driven  

Why it’s worth watching: The speaker and his team basically built a competitor of WALD (check #5 in the list). They offer it as a set of technologies forming a flexible stack that can deal with integrating data and extracting value from it.  

Our verdict: Again, if you are curious about technologies that can be used for building a modern reporting pipeline, you should watch it. And as a fan of the Brooklyn 99, I can’t help but admire the slides. Rating: 8/10

Details: https://pretalx.com/pyconde-pydata-berlin-2023/talk/A7B8P8/ 

Video: https://www.youtube.com/watch?v=na7yqvz5-B4&list=PLGVZCDnMOq0peDguAzds7kVmBr8avp46K 


As already mentioned above, there were many more exciting presentations at PyCon Berlin 2023. You can find the full list of sessions with descriptions in the conference schedule page. And, fortunately, the majority of the recordings are now available to everyone on YouTube! 

To wrap it up, I can say that PyCon is a great event for everyone who is passionate about programming, data, and, of course, Python. It inspires you to try new things and re-think your approaches, it brings you closer with your fellow developer community and gives you joy of learning from the best experts of your field. And of course, it’s a perfect reason to visit the vibrant city of Berlin and enjoy its amazing local food, nightlife scene, rich history and some of the most remarkable sights! We are looking forward to PyCon 2024, and hope that after this article you do too! 

If you are interested in our work within the Data Product Team, you can find more information here. We also showcase some of our data engineering & architecture projects here. 

Looker and Looker Studio (Pro), formerly known as Google Data Studio, are two widely used business intelligence tools of the Google cosmos that help creating interactive dashboards and reports. Both tools have their own strengths and are designed for different use cases and target groups. In this article, we explore the features of each tool and highlight their differences by describing typical use cases where they are best suited. We will also point out the most important advantages and disadvantages of the tools. At the end of this article, you will find a downloadable PDF file, summing up this comparison of Google’s BI tools.


Table of Contents

1. Looker

2. Looker Studio

3. Looker Studio Pro

4. Summary and Conclusion


1. Looker – The Ferrari among Business Intelligence Tools?

Looker Example Dashboard

Looker Example Dashboard; Source

Use case 1: Re-gain trust in the data and introduce self-service analytics in a scale-up

A data-driven scale-up observed that their data team was becoming a bottleneck when generating analysis and providing insights as all the company’s dashboards needed to be built by data analysts using SQL queries. Additionally, the company experienced some inconsistencies in metrics displayed in different reports, leading to diminishing trust in the data. The company wants to implement a self-service approach to provide data directly to the hands of their business users who are already data-savvy while ensuring that metrics follow the same definitions across all reports.

In this example use case, Looker is a desirable tool to tackle the problem of inconsistent metrics and enable business users to generate insights using data on their own without any SQL knowledge.

Looker is a data platform that allows companies to connect to their data warehouse(s), explore their data, and create visualizations and dashboards on top of it. It offers a unique semantic layer using Looker’s own language called LookML, which describes dimensions, aggregates, calculations, and data relationships in a SQL database. LookML is a mix of YAML and dialect-independent SQL used to create reusable, version-controlled data models. Looker uses these models to generate SQL queries against the database. LookML fosters data analysts and analytics engineers to follow the DRY (“don’t repeat yourself”) software development principle. It means that you write SQL expressions once, in one place, and Looker’s query engine uses the code repeatedly to generate ad-hoc SQL queries. Business users can then use the results to build complex analyses and dashboards in Looker, focusing only on the content they need, not the complexities of the SQL behind it. By removing the burden of knowing SQL to do data analysis, the company made a big step to enable self-service analytics.

The dimensions (e.g., “what is a user?”) and metrics (e.g., “how is MRR defined?”) are only defined in one place, making them consistent across all reports, which restored trust in the data of business users.

Example of Looker's own language LookML

Example of Looker’s own language LookML; Source: Google Cloud Skill Boosts


Use case 2: A large retail company wants to analyse data from multiple sources

A large retail company wants to analyse data from various sources, including their online store and physical stores, to uncover growth areas and develop a greater understanding of customer behaviour. The company wants to provide performance overview dashboards to their store managers, where each manager can only access the data relevant to them. They also want to embed customized dashboards containing insights on performance of specific products and buying behaviour into their partner platform and charge their main partner brands for access.

In this second example use case, Looker is the ideal tool to use because it can connect to a variety of data warehouses in which the customer keeps the data from their different data sources, provides row- and column-based user access management capabilities and white-label dashboard embedding. Looker’s access control feature enables teams to share the data and visualizations with only the relevant people, making it perfect for this use case where store managers and partner brands using Looker should only be able to see the data related to them.

By using Looker’s retail analytics block the company saved hours of work otherwise spent on data modelling and dashboard creation. The block provides a comprehensive overview of the company’s group and store performance, their customer’s behaviour, basket dynamics, and which customer segments or product bundles to promote. Looker blocks are templates for data models and dashboards that ideally only need to be configured by the user to go from database to dashboard quickly. They consist of pre-built LookML code blocks that you can copy to your project. Looker blocks exist for a variety of data sources and use cases (e.g.,  Hubspot Marketing, Google Analytics 4, Shopify). But be aware that some blocks only work out-of-the-box when the data is available in a specific structure or optimized for a specific database. You can check out all existing blocks in Looker’s marketplace.

To make the created dashboards available to store managers and ensure they only have access to the data relevant to them, the company made use of Looker’s access control and permissions management features.

  • They set up a “Store Manager” group to define content and feature for all store managers.
  • “Content access” defines which folders can a user or a group of users view or edit whereas
  • “feature access” controls the types of actions a user is allowed to do in Looker.
  • In addition, they configured row-level access, so each store manager only has access to data related to the store they are managing.

To open a further revenue stream, they created a dashboard containing information about product performance and buying behaviour and embedded it in their partner portal. For a small fee, individual brands could use this analytical feature to support and accelerate market research and even product development. Looker offers embedding contents like dashboards via iframe in multiple secure ways like SSO embed or private embed. The company also made use of Looker’s possibility to create custom themes to ensure the dashboard fits nicely into the existing design of their partner portal.

Additionally, Looker also provides a built-in scheduling and alerting feature, which enables users to automate reports to be delivered to different teams or stakeholders on a schedule or whenever a certain condition is met (e.g., return rate increased a set value), which saves time and effort.


2. Looker Studio – A great fit for smaller companies

Having gained a comprehensive understanding of Looker’s capabilities, use cases, and features, we shall now shift our focus towards Looker Studio, formerly recognized as ‘Google Data Studio’. This user-friendly platform offers a lot of direct integrations, especially for Google products, simplifying the process of connecting with diverse data sources and deriving valuable insights. Its intuitive user interface allows users to perform self-service analytics by doing simple data modelling and building quick charts with basic features but not so much interactivity.

Looker Studio New Report

Looker Studio New Report View


Use case 3: A startup wants to create simple, interactive dashboards to track the performance and growth of their product

A startup desires to track its sales and marketing performance following the introduction of its product on the market two years ago. They seek to generate streamlined, concise, and interactive reports for effective analysis of their sales and marketing channels. They require a tool that can be rapidly implemented and leveraged by non-technical users, as they lack significant IT resources. In this case, Looker Studio would be the optimal solution due to its user-friendliness, cost-effectiveness, and quick deployment, enabling non-technical users to gain valuable insights.

Looker Studio Visualization Options

Some of Looker Studio’s offered visualizations


Looker Studio is a cloud-based data visualization solution, offered free of cost. Its drag-and-drop interface empowers non-technical users to design dashboards and reports, with pre-built charts, graphs, and tables. It’s simple to also create defined calculated fields for specific metrics per dashboard. Scheduled data refreshes can be set up at the report level to ensure that the information is always current. Creating report templates and the possibility of report embedding in web pages is also available.

Being a Google product, it seamlessly integrates with Google products as Google Sheets, Google Analytics, and BigQuery, and can also connect to popular platforms such as Salesforce and Facebook Ads – for all connectors offered you can check here. Data blending is also available to do basic data modelling as ‘left joins’ but for building a more complex data model, a data team would need to set up proper data pipelines and models in a data warehouse. The tool facilitates collaboration and sharing within organizations to a limited extent (e.g., no defined workspaces) but Looker Studio Pro, a new upgrade offering from Google, provides additional benefits and will be discussed in detail in the upcoming section.

Data Source Connectors - Google

A quick view of data source connectors available


As there is no perfect solution, one of the disadvantages of Looker Studio is that it has only limited data modelling capabilities and no version control. In case the startup grows and its requirements towards their BI tool increase (e.g., more in-depth analyses, more complex visualizations that offer more interactivity, better collaboration, advanced sharing capabilities and user permissions), Looker Studio may not be the best suitable tool. While it is free to use, some of the data connectors and data sources require additional costs. Also, Looker Studio has limited support for big data and may not be able to handle large data sets efficiently.

In conclusion, when it comes to data analysis and visualization for smaller operations, Looker Studio is the preferred solution due to its ease of use and cost-effectiveness. However, if a company is experiencing rapid growth and requires additional functionalities, Looker or Looker Studio Pro would be the more appropriate choice. It’s important to keep in mind that while Looker Studio has its limitations, it’s still a powerful tool that can be utilized to generate valuable insights and streamline data operations for small-to-medium-sized businesses. By selecting the right tool for your specific needs and being mindful of its strengths and weaknesses, you can effectively leverage data to make business-informed decisions.


3. Looker Studio Pro – The older brother of Looker Studio

Looker Studio Pro is a comprehensive tool that builds on the functionality and user-friendly interface of Looker Studio. Looker Studio Pro comes equipped with an array of additional features targeted towards enterprise businesses, such as

  • the ability to define workspaces,
  • set user management permissions and roles,
  • and gain access to enhanced customer support through the Google customer care program.

The subscription model is estimated to be approximately $7 per user per month, subject to customization based on your specific business needs. To obtain a personalized pricing plan, we recommend contacting the Google sales team.

Use case 4: A mid-sized company that wants to create separate dashboards for each department

A mid-sized company is seeking to create distinct internal dashboards to monitor each department’s performance while ensuring ease of use, efficiency, and catering to non-technical users. To accomplish this, each department requires its own workspace, with defined permissions and user roles to control who can access, create, view, or edit reports. In this instance, Looker Studio Pro’s recently added features prove to be an ideal solution. With the ability to define team spaces, set user management permissions and roles, and access Google’s customer care program, Looker Studio Pro empowers users to streamline data operations while ensuring efficient collaboration and optimized performance.

One of the most significant advantages of Looker Studio Pro is its ability to create separate workspaces, enabling users to define individual or group-level access permissions for each workspace. In addition, Looker Studio Pro provides a variety of workspace roles, including manager, content manager, and contributor, to further enhance collaboration and control over data access – for more details about the roles check here. Notably, Looker Studio Pro eliminates the need to transfer ownership of reports when employees leave the company which is still a necessity with Looker Studio, saving valuable time and resources for businesses.

Team Workspace Pro in Looker Studio Pro

The new Team Workspaces feature available in Looker Studio Pro


Furthermore, granting permissions to view or modify assets within the organization can be accomplished through Identity and Access Management (IAM) in the Google Cloud Platform (GCP).

Permission Space GCP

The new Permissions space of the IAM section in GCP


Google is currently offering private access to bring Looker Studio content to Dataplex. Dataplex is an intelligent data fabric that empowers organizations to effectively locate, handle, oversee, and regulate their data across various data repositories such as data lakes, data warehouses, and data marts. This results in reliable control and enables large-scale data analysis, ensuring that data can be accessed with precision and accuracy.

Looker Studio Pro is a more advanced version of Looker Studio that comes with extra features, but still cheaper than Looker. This makes it a great option for medium-to-large sized companies that were missing enterprise access, permission and security features without breaking the bank.


Summary and Conclusion

In conclusion, Looker and Looker Studio (Pro) are all powerful data visualization tools, but they are designed for different use cases and targeted towards different customers.

Looker is widely considered to be one of the best BI solutions on the market, despite the existence of other promising tools (like Metabase, ThoughtSpot or Lightdash). Looker is best suited for companies that have large amounts of data, potentially stored in various databases and need a tool that can connect to all of them, clean, transform, and integrate data and create customized visualizations. It offers a powerful semantic layer for governing reusable metric and entity definitions, version control, scheduling and alerting, embedding into websites and applications, an API as well as extensive user and access management capabilities. Additionally, it is well integrated into the Google ecosystem, making it compatible with a variety of other Google products (like BigQuery). However, the cost of using Looker can be high, with monthly expenses reaching thousands of dollars, depending on the multiple factors like number and type of licenses needed and how it is deployed (self-hosted, hosted by Looker or Google Cloud core hosted). Other smaller downsides we see are limited visualization capabilities compared to Tableau (Looker does allow developing your own visualizations using Javascript, but that needs additional development resources). And that there is a bit of a learning curve when it comes to LookML. It is also worth noting that Looker is not meant for one-off analysis or exploratory work on new datasets, because the required dimensions and measures need to be modelled in LookML first. Additionally, since its acquisition by Google in February 2020, the quality of customer support has decreased, with fewer and less experienced people available to assist users. On the other hand, Google has increased their efforts of integrating Looker better into their existing product portfolio. With the recent announcement of “Looker Modeler”, Google is carving out Looker’s semantic layer as a stand-alone product and opens it up to other BI tools and applications.

Looker Studio is an excellent option for smaller sized businesses seeking to create simple, interactive dashboards and reports without breaking the bank or requiring extensive IT and data resources. It’s also ideal for individual analysis, one-off visualizations, and reports. Looker Studio can seamlessly handle a single data source, pre-aggregated datasets, spreadsheet data, and CSV files. While Looker Studio offers a vast range of native connectors, some may require an additional fee.

For those seeking greater control over user spaces, permissions, roles, and collaboration also through GCP, upgrading to Looker Studio Pro is an excellent option for a modest fee. Plus, with the Google Customer Care program, customers can expect exceptional support. Service-level agreements are also made available for the Pro version, which makes it a good option for enterprises.

As you now know, each tool has its unique strengths and limitations, and selecting the appropriate tool depends on your company’s particular requirements and use cases.


To help you match the strength and drawbacks of Google’s BI tools with your requirements and evaluate the best fitting solution for your company, you can find a structured summary of the tool comparison – ready to download – here:

Download full PDF overview


Do you have questions about Looker or Looker Studio (Pro), need support with choosing and implementing the right data architecture for your business or extracting data from your 3rd party tools and production databases into your data warehouse? Feel free to contact us via contact@feld-m.de – our experts will be happy to help you with advice, action and their experience!

You can find out more about our Data Product Services here.

Curious about how Google’s BI Products further develop or any other news, updates and best practices concerning the universe of Data and Analytics? Make sure to subscribe to our newsletter!


(more…)

Everyone is talking about CTV (Connected Television), IoT (Internet of Things) and Connected Driving. For a long time now, we have not only used the remote control to unlock the car, but also navigate confidently through the many options and conveniences of the digital car – from cockpit systems to the vehicle app on the mobile. We have these options because cars are now “connected” to the Internet – and processing personal data requires consent from data subjects also for connected technologies outside of websites. There are different requirements for the various analytics use cases that can create added value for manufacturers, users and third parties.


More data requires more data protection

The diametrical development of Big Data and data protection also poses a major challenge for the automotive industry.

  • On the one hand, more data can be collected than ever before: car owners interact with their vehicles via in-car multimedia systems or apps connected to the vehicle. The car itself collects data on driving behavior and the wear and tear of wear parts. Important functions from the engine and transmission are monitored to detect potential damage at an early stage and increase safety for drivers and passengers. So far, so good.
  • On the other hand, the use of this very data is becoming increasingly difficult: for some time now, the General Data Protection Regulation (GDPR) has been bindingly regulating what needs to be taken into account from a data protection point of view when processing data, especially during collection and subsequent further processing. If personal data is collected during driving or human-vehicle interaction, it may generally only be processed for further analysis purposes with consent.

The automotive industry needs to think about how it can process data in a compliant way and how users can really understand what is happening with their data, because only in this way informed consent to data processing by users or drivers is possible.

What personal data is collected in Connected Driving?

Connected Driving use cases primarily involve the following IDs, which are considered personal data under the GDPR and therefore require the consent of users before the IDs can be processed:

  1. User ID: This comes mainly from the field of web analytics or one of the dominant web analytics systems (e.g. Google Analytics, Adobe Analytics, PiwikPRO). It is randomly generated and does not actually refer to the user at all, but to the device or even only the respective browser. If a service based on a web application is called up via the in-car multimedia system, the user interaction can be collected via “normal” web tracking. As has been known for some time, consent must also be obtained for this type of tracking.
  2. Vehicle Identification Number (VIN): This is a unique ID for each vehicle. This ID can be used to track exactly which vehicle is involved. If this ID is integrated into data systems in which data is also collected from other systems, a unique link could in principle be established between a vehicle and a person. The processing of the VIN for analytics purposes therefore also requires consent.
  3. Login ID: Automobile manufacturers have also been trying for some time to provide individual sections for car owners. After buying a car, you receive an account with which you can use additional content and functions that are only available to the respective car owners. This content is only available after login. The login ID is unique per person (e.g., email address, username) and thus a datum that allows for exciting analytics use cases, but also requires consent for a specific purpose.

In order to implement both interesting and value-adding analytics and activation use cases, it is sometimes necessary to process these IDs (separately or in combination). Only through unique IDs, such as those mentioned above, can interactions and data points belonging to the same person or vehicle be linked. This allows us, for example, to gain insights into different driver segments and to understand the overall customer journey of car owners – from information gathering, to purchasing, to the use of login-based content and behavior in the car.


Connected Driving Use Cases – How can data from the vehicle deliver added value?

Analytics

The more data points a company has available, the more insights can be gained from them. The insights can then in turn trigger the improvement, adaptation or new development of functions, production or marketing measures.
From our experience, analytics use cases can be diverse and add real value by enriching them with in-car data. Possible use cases:

  • Understanding how users interact:
    How do drivers use the in-car and connected-drive features provided? What are the usage paths? How do the observed paths differ from the manufacturer’s intended user guidance? Which command control is preferred (e.g., touchscreen, center console, voice control)?
  • Plan for future developments:
    Are development efforts in proportion to actual use? How cost-intensive is the provision of individual functions and how often are they ultimately used? What are the most used functions and how present are they displayed?
  • Measure system performance:
    How well does the interaction between the car and other systems (e.g., app to control individual functions such as heated seats or air condition) work? What are the most common errors?
  • Creating different user profiles:
    Are there different segments of users in terms of interaction with the functions provided, e.g. music lovers, techies, purists? How do different user segments correlate with vehicle type (e.g., e-vehicles vs. sports cars vs. family vans)? How can we collect and analyze data on driving behavior to create different profiles of driver types?

With regard to consent for data processing, a distinction should be made between questions that also work without assignment to users or vehicles and those that require assignment to at least one of the IDs mentioned above. Especially when it comes to the pure understanding of interactions or the frequency of use of different features, such an assignment is not necessarily required. Creating segments and establishing a connection to the car, on the other hand, will not be possible without an ID.
As soon as the collection of one or more of these IDs is necessary to implement the analytics use cases mentioned, legally sound consent must also be obtained. Drivers must actively consent to the collection and be informed transparently about what data is collected for what purpose and how the respective car manufacturers (or their service providers) process it.


In-Car Activation

Once the data has been collected and processed, the next step is to activate it in the car itself. The multimedia system of a car offers an additional digital touchpoint which – similar to other touchpoints such as websites and apps – can be used for a direct and individualized customer approach. In-car data, if necessary together with data from other areas, can be processed in such a way that the use of the car, the driving experience or the use of digital services around the car can be adapted in a user-centric way.

For car manufacturers, this creates the following opportunities, among others:

  • Personalized in-car multimedia content: Similar to the personalization of websites or mobile apps, the data and insights generated from in-car analytics can be used to personalize the multimedia system. Depending on which functions a driver uses more often or at which times which functions are used, the interface can be personalized. If the data from different areas (app(s) connected to the car, personal login area, in-car) is also combined, a holistic personalized user experience can be built up that can be provided at all touchpoints involved – and thus also within the car.
  • Creating different driver profiles: If, in addition to the interaction data from the digital touchpoints, data from the car itself is also integrated – i.e., data on driving behavior and sensory data from the chassis and engine – different profiles can be created. For example, if a car is used by several family members or if several people in a company have access to a vehicle, a profile could be created for each person by processing the data. Machine-learning algorithms used specifically for this purpose could learn from the use of multimedia functions and the individual driving style of each person. If a person then selects their appropriate profile when they get in, their driving experience will be tailored as closely as possible to their individual needs.
  • Creating additional revenue via in-car sales: Additional touchpoints are also additional points-of-sale (PoS). While we are already used to making online purchases via our smartphone, it is also conceivable to do so via the touchscreen of our car. For car manufacturers, this offers the opportunity to provide customers with offers where they are really relevant. Assuming that the data is collected, integrated and processed appropriately, possible in-car offers could look like the following:
    • “You seem to be a sporty driver. Try our upgrade for engine tuning to the “Sport” package for only xx,xx €.”
    • “We notice that you like to travel. Upgrade now for only xx,xx € to the advanced version of our navigation system and enjoy additional benefits abroad.”

Admittedly, the more advanced the use cases become, the more the question of actual feasibility arises. Nevertheless, modern automobiles are already a valuable source of data, but they also have the potential to be an equally valuable customer touchpoint that can be activated. If the data is available in principle, or if it is at least possible to process it, and if the in-car multimedia system or the car itself allow flexible adjustments to be made, it is certainly possible to implement such use cases, at least from a technical point of view.

With regard to consent, the situation becomes more complex: If I want to activate data collected in connection with the use of Connected Driving in the respective car, it must also be possible to assign this data clearly and at any time to this car – or in some of the examples described: to the car AND to a person in the car. Appropriate, unambiguous and voluntary consent must be obtained and users must be able to revoke it at any time. This raises the question of whether consent must be obtained before every drive, since it is entirely possible that several people will use the same car. When the car is started, however, it does not yet know which person is behind the wheel. In addition, different people may have different preferences when it comes to consent for data collection and processing. When consent is revoked, it must be ensured that this revocation applies to all systems involved in the data architecture. A requested deletion must also be guaranteed for all systems.


Data sharing

Another category of possible use cases arises from data partnerships with third-party companies. Here, great added value can arise for all parties involved, but the advantage for one party can also become a disadvantage for another. This is relevant for consent, as a driver would naturally be cautious about giving consent for a data processing purpose that could also be detrimental to him or her.

An example of such a partnership is the sharing of collected vehicle and driving behavior data with insurance companies. In the form of a “pay-as-you-drive” model, insurance policies could be individualized and customized for each person. Data from the vehicle would allow insurance companies to better assess the underlying risk individually for each person. The insurance amount would thus not be calculated based on the entirety of all insured persons or general parameters, but individually for each person. However, this also shows the difficulty of such a model: If you are a careful and/or infrequent driver, such a model would be advantageous; for careless and/or frequent drivers, however, it would most likely be disadvantageous. If we now assume that consent is needed for this purpose of data transfer, the former group would increasingly agree, the latter would increasingly decline. To what extent an insurance company would benefit from a database of almost only cautious drivers is, of course, difficult to assess and foresee.

However, if the collection and sharing of the necessary data were to have an effect not only on the insurance amount, but also on the various components of an insurance policy, this could be of interest to every car owner. If, for example, different components of a policy can be added or removed depending on driving and usage behavior, each person could insure his or her own individual risks in the best possible way and tailored to his or her needs.

Another example, which is already largely a reality, is the sharing of vehicle data with car dealerships and repair shops. By processing and sharing data from the vehicle, repair shops can, for example, suggest service appointments directly in the display of the respective car or draw attention to offers. The more data from the car is collected, processed and made available, and the better the data architecture required for this is designed, the more advanced the use cases can be. In this way, predictive maintenance can help to detect wear and tear or minor defects at an early stage and proactively counteract possible damage. This saves the car owner money, while the car manufacturer increases the chance of long-term customer loyalty thanks to an improved customer experience.

Looking at these data sharing examples from a consent management perspective, they are not very different from those of in-car data activation. If personal data is collected and processed – which is the case with these use cases – a GDPR-compliant consent is required. Providing detailed information about the purpose of the data processing is crucial here. Especially if the processing involves third parties – such as insurance companies.


Consent rates and transparent communication at the point of consent

It can be assumed that customers will be cautious about sharing their data with other parties and will initially be hesitant to have their own driving style evaluated and assessed. In these cases, therefore, automakers are particularly called upon to build trust – both in advance and at the point of consent – in order to obtain a reliable and truly value-adding data basis. Transparent communication and the highlighting of an expected benefit for the respective person should therefore be a core element of consent management. But here, too, the question arises as to how the obtaining of consent, the processing of the data, and the ultimate use of the data can be optimally designed in the specific case – especially in scenarios in which several people have access to the same car, but do not want to be confronted with a consent banner or call for consent before every trip. A consent status that may change on a daily basis also prevents cohesive data and insights, which calls into question the fundamental added value of the data as it becomes more irregular and severely limits the number of meaningful use cases.


Data power and responsibility: who actually owns the data from the car?

Who exactly owns the data from the car is still legally unclear: Does it belong to the car manufacturer who collects it or to the owners of the vehicles? The tech companies that make the connected car possible in the first place? The public, since the data would enable fair(er) competition? Consumer advocates, automotive suppliers and insurers fear that the planned EU law that was supposed to answer this question will now be delayed again.

So far, the normative power of the factual has prevailed: The problem is that the data is currently held by the vehicle manufacturers, giving them a major competitive advantage over third parties, suppliers and startups. Not to mention the data sovereignty of individuals. A final decision that could break this data monopoly of the manufacturers is no longer expected during this EU legislative period, although a draft law should have been available as early as 2021. The delay will now create facts in favor of the manufacturers, who will be allowed to keep their data monopoly for the time being. The industry is pleased.

However, access to this mobility and vehicle data would be quite crucial for new business models. “According to industry sources, 40 to 50 data points are needed from a vehicle in order to implement new insurance concepts such as “pay-as-you-drive” or remote diagnostics or maintenance. Suppliers also have a strong interest in third parties such as independent repair shops having access to vehicle data. An independent repair market is a prerequisite for them to reduce their dependence on the major automakers.” (Kugoth 2023)

One possible scenario would be for the EU Commission to forego regulations for this specific sector and instead refer to the Data Act, which is intended to make data more usable for third parties. However, the automotive industry would not agree with this at all, as the Data Act – analogous to the EU’s most recent digital laws, such as the Digital Services Act – focuses on users, who are supposed to retain sovereignty over their data – even though it would presumably be difficult for most car drivers to penetrate what their driving and vehicle data could ultimately be used for. Whether the German government will include the issue of data access to vehicle data in the planned Mobility Data Act remains unclear, but is currently being examined.


Kugoth, J. (January 30, 2023), Brüssel bremst bei Fahrzeugdaten, Mobilitätsdienstleister empört. https://background.tagesspiegel.de/mobilitaet-transport/bruessel-bremst-bei-fahrzeugdaten-mobilitaetsdienstleister-empoert. March 1, 2023.

Thanks to David Berger and Gabriela Strack (Bay-Q) for input and legal advice.

Dark Patterns in Consent Management – and why you should do without them

Dark patterns are familiar to most of us, especially from the so-called “social media”, but they are increasingly finding their way into cookie banners and consent management. The GDPR provides very clear guidelines on how valid consent must be given, namely, above all, voluntarily and informed. The moment users give consent based on manipulative dark patterns, we have a data protection problem and it is becoming apparent that the topic will receive even more attention and regulation in the future.

In our paper, we would like to show you what dark patterns are, which forms are particularly common in consent management, and teach you how you can recognize dark patterns as a user and avoid them as a website or app operator. Furthermore, we will explain the difference between illegal dark patterns and permissible “nudging” and give you an overview of the relevant legal bases and judgments. Finally, we illustrate which problems arise from manipulative and complicated consent banners with regard to accessibility and why good and user-respecting consent management should be understood as a trust-building measure in the customer relationship.


Download full PDF here (German)


Tl;dr

  • Dark patterns are manipulative design elements. They are being used more and more frequently in consent management to achieve the highest possible opt-in rates.
  • The most common dark patterns in consent management aim to mislead or make opting out unnecessarily lengthy and complicated.
  • It is not always possible to draw a clear line between permissible nudging and impermissible dark patterns. Mostly, the two differ in the degree of manipulation, the pressure with which a certain action is stimulated in the user, and the intention or the result.
  • There is no explicit “Dark Pattern law” yet(!), but some regulations that can already be applied.
  • The use of Dark Patterns in Consent Management also reduces the accessibility of your website.
  • Consent management should be understood as a trust-building measure in the customer relationship. Dark patterns, on the other hand, create intransparency and mistrust.


Original photo by Eric Masur on Unsplash

Tl;dr:

  • The TTDSG regulates provisions on telecommunications secrecy and data protection for telemedia, i.e., websites. It replaces the data protection regulations of the Telemedia Act (TMG) and the Telecommunications Act (TKG), adapts them to the regulations of the GDPR and primarily serves to implement the ePrivacy Directive.
  • The aim is primarily to create legal clarity.
  • Protection of device integrity: from the 1st of December 2021, websites will need genuine consent from users for cookies and tracking.
  • Almost every website thus needs a DSGVO-compliant Consent Banner.
  • The TTDSG also applies to messenger services and apps.


Background to the TTSDG

On 01.12.2021, the new German Telecommunications Telemedia Data Protection Act, or TTDSG for short, will come into force after being passed by the Bundestag in May 2021. As the first draft of the TTDSG was completed only in July 2020, one could say it was implemented very quickly. But in fact the opposite is the case: The German legislature is the last of the European legislators to comply with the implementation obligation from the 2009 ePrivacy Directive. The impetus for the swift action was also provided by the supreme court rulings of the European Court of Justice and the Federal Supreme Court, which did not look at the German legislator favourably.


The most important regulations in the TTDSG for website and store operators

Below you will find the most important points to consider when tracking your customers and users on your website or app.

The good news first: There will be no serious changes to the legal situation. Similar to the application of GDPR, the new law implements the practice that has already been in place since the BGH’s Cookie ruling of May 28, 2020. It reconciles the areas lacking clarity in GDPR with the ePrivacy Directive requirements.


Validity and scope

The TTDSG is applicable from the date of entry into force (December 1, 2021) with no transition period. It applies to all companies that have a branch in Germany or offer goods or services in the German market.

It applies independent of technology i.e. it applies in the area of tracking technologies not only to cookies, but also, for example, to the use of browser fingerprinting or the use of local storage.


Focus and differentiation from the GDPR

The TTDSG focuses on storage on users’ end devices and the reading of device identifiers; the processing of personal data, on the other hand, continues to be regulated by the GDPR.


Storage locations

The new TTDSG makes no distinction as to where data is stored (e.g., locally or in the cloud).


Storage/extraction of information without consent.

The TTDSG allows information to be stored in the user’s terminal equipment (setting a cookie) or to access information already stored in the user’s terminal equipment (reading cookies). This can be done without the user’s consent if the storage or access is absolutely necessary so that the telemedia service (website/app) expressly requested by the user, can be provided by the provider.

The subsequent processing of personal data is then also permitted without consent.


Technical necessity of analysis & administration functions

Analysis technologies (cookies) can be considered absolutely necessary if they are used, for example, to measure performance, detect navigation problems, estimate required server capacities or analyze retrieved content.


Tag Management Systems

The use of tag management systems is generally permitted without consent. When using Google Tag Manager (GTM), which is part of Google Universal Analytics, there are concerns regarding consent-free use. The consent-free use of GTM should therefore be clarified with your own legal counsel.


Legitimate interest

If cookies or other tracking technologies are to be used in accordance with legitimate interest, the legitimate interest must be described and justified in the data protection provisions.


Dynamic purpose limitation of cookies

If a cookie is set to store or read both information that does and does not require consent, and if users do not give their consent, the identifier stored in the cookie may only be used for the purposes that do not require consent. The purposes requiring consent must be omitted. These purposes must be defined in advance, adhered to during use, and users must be informed about them transparently.

This is the case, for example, if the tracking cookie was modified for range measurement when implementing anonymous tracking. If the user agrees to standard tracking that requires consent, the previously set cookie would have to be deleted and replaced. This should then be done whenever the consent is modified in the privacy settings.


Information requirements and consent management

The TTDSG prescribes a comprehensive information obligation only for access requiring consent. Obtaining consent is subject to the same conditions as under GDPR and must be carried out by a confirming action, e.g., on a corresponding button of a consent banner, and it must also be possible to withdraw it again with the same effort. Existing installed consent management platforms can therefore continue to be used as before and may also be used without consent.


Storage periods and criteria

When providing the information, care must be taken to specify not only the storage duration, but also the criteria for the lifetime of the cookies (e.g. automatic deletion by the browser due to inactivity).


Browser settings, PIMS and plug-ins.

The TTDSG does not require that individual settings in the browser (opt-out) be taken into account. However, the TTDSG obliges the future German government to ensure by statutory order that browsers take into account the current consent status of users. This is to be done with the help of Consent Management Services known as PIMS (Personal Information Management Systems). PIMS enables users to clearly document and control their declared consents and objections for the websites they use. The legal ordinance will also contain specifications for the design of PIMS with regard to user-friendliness, conformity with competition law, and technical implementation. The corresponding ordinance is expected to be issued next year. In the meantime, you can find more information on the classification of the ADPC program of the Austrian Data Protection Association noyb as a PIMS here.


Fines and penalties

The TTDSG makes use of its own fine framework with an upper limit of EUR 300,000, which becomes effective in case of violations of the consent requirement. However, the same violation can then no longer be additionally sanctioned by the GDPR.


Outlook: What’s next for data protection law, cookies and tracking?

One of the most exciting points in the TTDSG is the aforementioned PIMS, the design, implementation and use of which are not yet clear. In 2022, an expert commission of the German Federal Ministry of Economics will discuss the technical nature and possible deployment variants of PIMS. By the end of 2022, the commission wants to have passed the technical requirements in parliament, so this change will have to be considered in the foreseeable future. (Source: Tagesspiegel Background Newsletter of 04.11.2021 “Delegated data sovereignty”).

This could mean that by the end of next year, “Consent Management” will be the sole responsibility of users and consents and revocations can be managed centrally with one click – for example in a browser plug-in. This has the potential to make Consent Management Systems on websites obsolete, as the latter will be required to listen to the users’ will according to the PIMS. However, we do not consider the extinction of classic Consent Management Systems to be very likely at present, since a user’s will can ultimately be represented more directly by the targeted opt-in or opt-out on a website, than by global consent or rejection via PIMS. However, it remains to be seen exactly how this will play out. A new wave of success for micro-consents i.e., consents that are requested directly at the respective point on the website, e.g., whether one would like to have the original tweets displayed on news pages, is also quite conceivable.

In addition, the ePrivacy Regulation, which is still being voted on, and the Digital Services Act could also bring some innovations in the future. As you can see: Only change is constant in the world of digital data protection.


Contact us if you would like to shape the change at your company together with us.

This information was developed together with the data protection experts from Bay-Q (http://www.bay-q.com/).

Part 1, The Datacroft „Link Manager“ Campaign Tracking Tool

The field of marketing technology (MarTech) has been growing at an astounding rate over the last years. Some months ago, there were an estimated 8.000 different tools and solutions out on the market*, and these numbers are expected to explode a lot more in the future. Because we at FELD M have been developing Martech solutions under the brand „Datacroft: FELD M Products“ since 2012, we wanted to give a „behind the scenes“ retelling of why we decided to create our products – our products` origin stories, so to speak 😊

MarTech map

But let’s first go back to the Martech map: The reason that the numbers of MarTech solutions have increased so much, is that the development conditions have improved drastically: In all fields of marketing, from ad serving to CDPs, from personalisation to sales operations, from content creation to workflow management, there are efforts to automate and/or improve specific aspects of marketing by developing new tools, so that they can be dealt with more efficiently and therefore less costly for clients. Another essential part of these solutions is that they usually integrate into all other MarTech tools in a client‘s tech stack, so that a number of tools can be linked together to further optimize workflows and reduce overhead. The overall aim of MarTech tools is to automate, augment and integrate.

Some of these new tools are being developed by service agencies themselves, because these agencies have seen a need to either create a solution to meet their own internal requirements as a marketing agency, or they are meeting demands raised by their clients **


This mirrors exactly the way we at FELD M have come to found our own business unit, Datacroft: FELD M Products, in order to develop our own „little helper“ tools and solutions to help our clients understand and optimize their marketing activities in a data-driven way. We now want to give you a deeper insight into how we came to think about developing our products – and will start in part 1 with our campaign tracking tool, the „Link Manager“.

The Datacroft „Link Manager“

Our motivation for developing our first product was quite straight forward: We were in Excel hell, and wanted to escape.

To be more specific, back in 2012 we were tasked with maintaining and validating one global campaign trackinglink structure for a large number of markets and business units of a big corporate client of ours, which back then was done with several market-specific Excel files, that had been configured by us, following client requirements. The problem was that some of these markets had their own idea of how their campaign tracking should look like and got quite good at using our Excel templates in every way they could think of – just not in the way we (and our direct client, the corporate head department) had intended so that the data could be analyzed channel-wide and on a global level. Finally, we were able to convince the head department of our product idea and they gave us the go- ahead so that we could start developing the Software-as-a-Service tool that now has become the „Link Manager“.

Now we had to think of the features we wanted to add to our new tool that should still grant the markets the highest possible degree of flexibility and freedom, but only to the extent that our client`s goal of channel-wide and global analyses was not compromised.

To start with, we wrote down our own experiences with campaign tracking on client projects so far, to find out what our tool should offer our users:

  • We were often asked to create trackinglinks on very short notice, because campaign tracking was thought of only very shortly before a campaign launch – so usually at that point we got very urgent emails or phone calls because there were trackinglinks still missing, and our clients needed them NOW, IDEALLY YESTERDAY!
  • There was also often important campaign data missing which had to also be added on short notice, for example new campaign names or product names. Whenever the correct values could not be added in time, users would often use any kind of value that vaguely matched their campaign types (or not…), which of course decreased data quality.
  • The two points mentioned above – missing trackinglinks and missing or faulty data – lead to a general poor quality of campaign data in web analytics reports, which we had to face when our clients asked us to create campaign reports based on this data. These reports then often were quite useless, and could not be used to analyze current campaigns or to optimize future ones (which btw should always be the goal). Often we had to either try and create some kind of insight by making assumptions, based on past data that hopefully was correct, or we tried to find other data points that we could use to fill in the gaps. All in all, it was not very satisfying work, because the main problem – the poor data quality of our client’s campaign traffic – was not dealt with.
  • During the campaign tracking process, we had to communicate with people who had different skill and knowledge levels, and a different awareness of the importance of campaign data: From the web analyst on client-side, who looked into their reports every day and had detailed knowledge of tracking implementations, to service agency account managers, who would never get to see and use the data that they were asked to add and had no knowledge of web analytics tracking implementations. Since our tool was going to be used by both of these user groups, we had to have both in mind when thinking about the interface and features.
  • We also had to deal with different technical tracking requirements for our clients. Often, with our clients, a campaign tracking structure had evolved over years and had sometimes become quite complicated and locked in. Scrapping everything and starting again with a new, clean structure was often not an option. The campaign tracking setup also sometimes had to not only meet requirements of web analytics solutions (our tool supports any type of web analytics solution, btw, not just Adobe Analytics) but also those of other tools that had been added over time. So a „one-size-fits all“ approach did not always work for all of our clients, they required a lot more custom development.


Based on these experiences, we came up with the following development guidelines:

  • Easy access for everybody: We give out unlimited user logins for each client, which everybody can access via their browser. So even if things are very urgent before a campaign launch, there will not be a bottle-neck because the colleague with the licensed user login is unavailable.
  • Easy-to-use interface: No knowledge of tracking implementations neccessary. That way, every user is able to add new data and create new trackinglinks on short notice.
  • Bulk upload feature: Not everything you can do in Excel is bad, of course! Especially when dealing with a lot of trackinglinks at once, an Excel-based solution can be very efficient. That’s why we developed a solution to create trackinglinks in bulk in an Excel file that can be uploaded in our tool, so that our users get the best of both solutions.
  • Automatic validation of trackinglink data and URLs, so that data quality in web analytics reports increases and broken landing page URLs can be detected before they are added to marketing measures. Because useless campaign data will lead to useless campaign reports, we wanted to make sure that our users are able to select the right data as fast as possible and spot any errors without having to do manual quality checks.
  • We can also restrict the new data that users can add and/or select in the tool so that they have to conform to predefined naming conventions which again increases data quality. As we mentioned above, we want to both guarantee as much flexibility as possible for each channel type, because often channels will have their own specific data points, but we also want to make sure that the campaign data is set up in a consistent structure that makes a global, channel-wide reporting We can for example prefill dropdowns with values that cannot be changed, to ensure that a consistent spelling is used. We can also restrict the input possibilities of free text fields, so that users have to conform to a specific format, like for example only using lower case letters, no spaces, using only underscores as delimiters etc.
  • Custom developments based on client-specific requirements: It has always been very important to us to find ways to meet specific client requirements and to fit our solution as closely to our client’s existing infrastructure as possible. This way we can of course also find new feature ideas that can be useful to all clients. We for example adapted our trackingcode logic so that it can be filled with abbreviated campaign values after our client MINI Germany requested it from us (instead of using a unique ID trackingcode, which we had done before). This requirement came about because their trackinglinks not only had to work for their Adobe Analytics setup, but also for their CRM tool „Top Drive“. It now is a standard feature and has been used for many different kinds of trackingcode logics for our clients.

Now, in 2021, our „Link Manager“ SaaS-tool has been licenced by a number of clients over the years, from a medium-sized eCommerce business to global corporations with a large number of markets like BSH Group and BMW Group.

Because we already started 9 years ago, and we were always closely aligned with our clients‘ requirements and needs, we are now able to offer a level of product innovation and technical maturity in the „Link Manager“, that other providers are not yet able to reach in their product cycle.

For more information about our tool, please visit our product page at https://datacroft.de/en/link-manager/

In part 2, we are going to talk about the „Campaign Data Importer“, a tool that is closely aligned with the „Link Manager“!

Start page – searchable overview of all trackinglinks in the data base


Link creation interface

Automatic URL check

Bulk Upload functionality, to create a large number of trackinglinks at once


*source: https://chiefmartec.com/2020/04/marketing-technology-landscape-2020-martech-5000/

**source: The Martech Show Episode #5: 5 Martech Trends for the Decade Ahead / The Agency View: https://www.youtube.com/watch?v=DnMAl5d0Zx8

How FELD M implements your complex web analytics tracking setup in a tag management system

It is not unusual that country websites differ not only in language, but also in content. This usually requires a complex web tracking setup in the tag management system, especially when multiple stakeholders also come into play.

The seemingly unsolvable difficulty: one tracking setup for multiple markets

FELD M already knows this scenario very well, as many of our customers are confronted with such a constellation and the different goals of the individual stakeholders. These partners, such as the web analytics department of a company, the management, the marketing department, the market managers, or the product owners usually want different information in the respective level of detail. An overarching KPI concept is, therefore, a prerequisite for such a complex tracking setup anyway.

Who needs which analytics data?

Focusing on the following two stakeholders, we exemplify how diverse the requirements for web tracking can be.

Stakeholder: Central Web Analytics Department

Often, there is a central department in the company that specifically manages web analytics and tracking. This department wants to ensure that tracking is uniform and scalable on all country websites. As a rule, the markets should not be able to change the uniform web tracking, as otherwise cross-country analyses are no longer possible.

Stakeholder: Market Responsibles

At the same time, there are also market managers who want to customize and track specific content on their specific country pages. For example, they may want to manipulate content to trigger A/B tests or they may want to track modules that they have developed specifically for the market. In addition to web analytics for their own market, market responsibles often want to integrate marketing tags on their local websites.

No size fits all – Different tools require different solutions

FELD M has already implemented this complex setup for several customers in different ways. But why do we need different approaches at all? This is mainly due to the respective tool stack of our customers. Every tag management system and every analytics tool has different functionalities. So there is no one truth. Or is there?

How FELD M reconciles the analytics requirements: The silver bullet for this kind of tracking implementations

We have found an all-purpose solution! The prerequisite for this is a tag management system that enables a granular role and rights concept as well as inheritance between different layers. We will go into these levels or layers in more detail in a moment.

Cheers to the data layer and tag management for advanced users

To address all the requirements of the stakeholders, a uniform and structured basis must be created. This basis is the data layer: a JavaScript object on the website that contains all tracking-relevant information. An identically structured data layer across all websites enables a scalable tracking setup in the Tag Manager.
With an appropriate structure in the tag management system, all tracking and stakeholder requirements can now be met. A modular structure ensures that there is no negative interference.

Layer 1: Core Tracking
Core Tracking is the key element for tracking all websites, regardless of language and content. It can be rolled out with almost no additional effort and ensures basic tracking.

Layer 2: Module Tracking
For specific modules that are used on different market sites, for example, or that require more detailed tracking that cannot be mapped via the core tracking, there is a second layer in the tag management system. Here, the core tracking is extended in a modular way.
Only the central web analytics department has access to layers 1 and 2. This ensures not only that there is uniform tracking across all pages, but also that more specific tracking requirements can be mapped. The central management of tracking means that all data can still be analyzed across all markets.

Layer 3: Market Level
Market managers can exclusively access this level in the Tag Manager. This allows them to make specific adjustments for their market and include special tracking, marketing tags or feedback tools. FELD M offers training on this so that individual markets can get the most out of their websites!

Low maintenance effort and high data quality: everybody wins

Thanks to the modular structure in the tag management system, the data quality remains high. There is low maintenance effort, which of course saves costs in the long run. So, we turned the conflict situation at the beginning, which involved different goals from various stakeholders, into a win-win situation.
A big advantage of the described approach in the Tag Manager is that an administration of tags can take place on different levels. The respective people in charge have access to the corresponding layers and can adjust on the global level, but also on the website level or market level. For this purpose, FELD M configures different roles in the tag management system to enable but also restrict accesses.
And analysts will be happy too: the web analytics data is of high quality and consistent across websites, applications, and markets. Happy analyzing!

FELD M will gladly advise your company on which tag management setup meets your requirements and which tag management system is suitable for this. We are specialists in the field of web analytics and have already implemented tracking systems including data layers for many companies of different sizes.
You can find out more about our digital analytics services and more about FELD M’s projects.

With Google Analytics 4 (GA4) (formerly App+Web property), Google is launching a completely new tracking tool. This is the first time in the history of Google Analytics that a hard cut is made in the data, because historical data cannot be transferred to GA4. The data model has also been revised. After 15 years of GA with only incremental updates everything is new. But what does this mean for your company? And how can such an upgrade be carried out when Google Analytics is already deeply integrated into the company structures?  

In this article, FELD M takes a closer look at the strategic advantages of setting up a new GA4 Property and collecting data in parallel to the previous full implementation with GA Universal Analytics.

From a technical point of view, the new GA4 can hardly be compared to the old GA Universal Analytics (GA UA): the basic concept has been completely reworked by Google. The biggest challenge for companies is probably that the data cannot be historically transferred by the new data schema. So with GA4 you start collecting data again from zero. This makes such simple requirements as year-over-year comparisons difficult.  

Even the transition itself can be complicated lengthy if the old Google Analytics is deeply integrated into the company structures. If external systems are connected through BigQuery, CSV exports and imports or the Reporting API are attached, the switch to GA4 requires a lot of technical effort.  


The dual strategy  

Both Google and FELD M recommend a dual strategy for most of our customers. Both systems are used simultaneously. This setup can realistically last for 2-3 years or even longer.  

Furthermore, the current state of GA4 is not sufficient for all companies. Some familiar features from GA UA may still be missing. For example, eCommerce reports have only recently been introduced in GA4.  

The dual strategy helps companies to get the best of both worlds: the familiar reports from GA UA and the new features of GA4.  

The 3 advantages of a dual strategy are:  

  1. Connections to external systems can be adequately planned and cleanly transferred  
  2. A data history can be built up in GA4, allowing comparisons with past periods (e.g. YoY comparison)   
  3. Google has time to publish more features for GA4, because there is still a lot of room for improvement  


1. Connection of external systems 

The different possibilities to export and import data from GA offer excellent approaches to integrate external systems. Be it attribution reporting in tableau, Datastudio dashboards based on BigQuery or cost uploads for marketing campaigns.   

With the new GA4 the connections to external systems have to be adapted.  

Although GA4 has an integrated export to BigQuery (and this time for free), the data schema has changed. Even the familiar Reporting API no longer works. The new GA4 Data API is currently still in closed beta status.  

Having both systems running simultaneously for a longer period of time helps to adapt external systems, saves developer resources and keeps the core business operating 

 2. Data history 

Not being able to use historical data that has been recorded for a long time poses a challenge for a data-driven company. Annual comparisons are no longer possible. Long-term trend analyses are hardly feasible. However, hard breaks in the data occur from time to time, not only when changing tools. For example, a website relaunch can also cause a major break in the data, which means that long-term comparisons are no longer meaningful.  

To prevent this, the dual strategy helps by capturing at least basic information already in GA4. It is best to do this as early as possible so that as much data as possible can be historically recorded.  

3. Further features and releases of GA4 

Just recently, GA4 has already been classified as “production-ready” by Google. This means that a certain guaranteed availability is given. Companies can already switch over without worries. 

Nevertheless, Google continues to focus its developer resources on GA4. More features and improvements can therefore be expected in the coming months. In GA UA, however, no significant updates are expected in the meantime.

What should companies do now?  

Web Analysts should start using GA4 now. Ideally, the GA4 tracker can already be built into their own website (or sub-section) to collect data for their reports. GA Universal Analytics will remain the same. The focus must now be on GA4.  


How can FELD M support?  

As an agency specialized in analytics, we are experts in using Google Analytics (and other web analytics tools). Through our daily business with our customers and the analytics scene, we are always up to date on what’s new at GA4. In a long-term dual strategy, i.e. the transition from GA Universal Analytics to GA4, we can help to develop the new connections, design improved tracking and gain more insights from the data.  

You can find out more about our Digital Analytics Services here: https://www.feld-m.de/service/digital-analytics/ 


(c) Image by GraphicsSC from Pixabay

In 2020, everything turned out differently than planned and the organizers of the big conferences had to rethink their plans. As a result, most events in the digital industry took place online. But this also means that there are a lot of interesting events around the world that one could potentially attend and the agony of choice affects many of us: Which conference is really worthwhile?


I have participated in three conferences for FELD M this year. In Tealium’s Digital Virtualocity in June and the Greentech Festival in September, which was half on-site in Berlin and half digital, and in the DMEXCO@home, which was purely digital. I would like to share my impression of the last two with you. Of course, the content aspects can only be of secondary importance here, since each of us is interested in something different. What you already know in one area may be completely new to me and where I think I know better than the participants on the conference panels, it may be a profitable talk for you. That’s the way it is with diversity, different interests and competences. So, in general, this should be about what you can expect from the two conferences – should they take place in a similar setting again – and what my personal impression was.


Quod erat expectandum: expectation vs. reality

The founder of the Greentech Festival, which calls itself “the smartest stage for green success”, is former Formula 1 world champion Nico Rosberg. How exactly Formula 1 and sustainability are supposed to go together was a mystery to me beforehand. However, my greentech day started with listening to Gabor Steingart’s Morning Briefing for breakfast before the event and Nico Rosberg was a guest in this podcast. There he impressively outlined what his life looks like after Formula 1 and why he is now interested in sustainability issues, especially in the tech sector. That was not only interesting, but also credible and raised my expectations of the event a bit.

In fact, my rather low expectations were even exceeded. The festival started with an outstanding show act by media artist and robotics engineer Moritz Simon Geist. With opening speeches by, among others, Nico Rosberg and former Foreign Minister Joschka Fischer, the spectacle began in a top-class manner and was continued in the same way. Representatives of innovative start-ups, large corporations and the United Nations organized the keynotes and panels. Schedules were meticulously adhered to, and what was most exciting: there were also many critical questions on the panel, which really did not harm the credibility of the whole event.

My expectations of DMEXCO were high. The prospect of experiencing Europe’s largest congress trade fair for the digital industry from the comfort of my home office made me eagerly await the event – even though the huge program had already overwhelmed me somewhat in the run-up to it. As expected, some of the panels and keynotes were really very informative and well prepared, others rather underpowered me – but that’s always the case when you can put together your program from so much on offer.


Tomorrow, today is already yesterday: future proofness

Both festivals had really innovative themes. While the Greentech Festival naturally focused on sustainability issues (especially with regard to questions of mobility and nutrition for the world’s population), DMEXCO@home was more about innovative technologies and methods. Many providers presented their latest tools, while corporations reported on their digital strategies. In between, there was a lot of talk about the new challenges that data protection presents and everything that is connected with it. But there was also room for more social future topics such as corporate digital responsibility strategies, female leadership or best practices for a congenial brand identity in the 21st century – from Berlin’s public transportation companies to the Eintracht Frankfurt soccer club – and these were a useful addition to the program.


Order is half of life: Organizational impressions

The one-day greentech festival with one main stage and only two smaller side stages was much easier to handle as a participant than the DMXCO@home, which already required a lot of brain power when watching the program to choose which panels or keynotes to watch. A bookmark function made it easier to keep track of things, but I would be lying if I didn’t admit that I still missed things I would have liked to see, simply because the view of the different parallel strands was just too confusing for a normal Macbook. In any case, you should allow plenty of time for this in advance.


Supreme Discipline: Networking!

I love fairs and conferences. Not least because of the illustrious rounds at plastic tables. With online conferences, of course, it’s not so easy. DMEXCO@home in particular offered to log in to the portal in the run-up to the conference, and this time was used intensively for networking. Even before the conference started I had several requests for a short call on one or the other topic. Of course, these were mainly tool providers who wanted to work with us and hardly any potential customers, but the networking idea was implemented quite well at DMEXCO@home. At the Greentech Festival the online networking possibilities were less, but this was probably due to the fact that the event was partly held in Berlin. Networking was possible via a chat function, which was used to post the LinkedIn profiles and thus initiate networking.


Conclusion and highlights:

Participation in the Greentech Festival was free online, the DMEXCO@home cost around 100 euros for both days. The price was justified in any case.

I was positively surprised by the Greentech Festival, because the event was really very professional and at the same time very pleasant. The diversity of the participants* at keynotes and panels caught my attention positively, as did the fact that it really seemed to be about the cause, and not about the best possible self-portrayal of greenwashing. If you are interested in ecology and sustainability in digitization and industry, you will certainly not go wrong with the Greentech Festival. Almost without exception, the speakers* were worth hearing and seeing.

DMEXCO@home is certainly the better choice for anyone focusing on the digital industry. This is certainly not a new tip for old conference-goers, but I’ll say it anyway: it’s a good idea to take the time to study the program in advance and choose the relevant contributions. All in all, there was a lot of exciting and up-to-date information, so that really everyone can learn something.

Of course, it is difficult to compare these two events, because the direction of the program is different. But if you want to keep up with what’s happening in the industry and the digital economy, both events are a good place to go, perhaps more so at one than the other, depending on your personal preferences.

The highlights for me were of course the contributions that were directly related to our customers. Besides, I attended many presentations on data protection, TCF 2.0 and cookie-less tracking, heard a lot about CDPs and DMPs, and got to know different tool providers.

My personal favorites across both events, where I was able to get a lot of input and/or new ideas, were on the one hand the above mentioned master class about the Berlin public transport company, which showed how BVG became a real lovebrand through Social Listening.

On the other hand, it was the master class of the BVDW (German Association of Digital Economy), also at DMEXCO@home, on the topic “Corporate Digital Responsibility (CDR): Why a common understanding is necessary”. There, insights into the current state of affairs at the BVDW were given and comprehensibly outlined where the difficulties lie in generating a common understanding of terms and standardized templates for CDR. Especially CDR will influence many aspects of our daily work in the future, so it was important to find out how far the currently leading consultancies and associations are in this topic and in which direction it will go.

Spoiler: Of course, we at FELD M have always been concerned with the topics of digital responsibility, IT security and data protection as well as the social design of digitized processes. Soon, a first summarizing blog post on our CDR approach will appear here. Stay tuned!

Let’s get this party started – A promising first contact

In mid-March 2019, we received a message from Christian Weber, the COO of Freeletics, via the contact form of our company website. A former colleague from Switzerland had recommended us because they needed support in the redesign and development of a solution in AWS to replace the existing data warehouse.

In love with Data – A slight tingling sensation

In the meantime, I sometimes like to call myself an IT grandpa. For more than 25 years now I have been building various things on the net. In the beginning it was the Linux router at my family home, which served the family with internet over the LAN and helped me to understand the basic functionality of the internet and its protocols like TCP, UDP or HTTP. Today I support our customers with my team in designing and implementing applications for the Internet.

Helping the well-known startup Freeletics to replace their DWH and design a new, future-proof architecture immediately triggered a slight tingling sensation in me. The amount of data to be processed had to be immense!

Although we had already implemented projects on-premise and in the Azure cloud, including what are now often referred to as “big-data” projects, we had only gained basic experience with AWS at that time. We therefore did not want to call ourselves experts in this area. But with enough respect for the task, we decided to take a closer look.

It’s a match! – A quick start

After a first meeting with Christian and his data engineering team, it soon became clear that we were going to work together.

The team understood what was important: an in-depth understanding of technologies and their interaction in general, as well as experience in designing and implementing applications.

Understanding the past – Understanding the existing system

To develop a new, future-proof system, we first had to understand the existing system. The team helped us to get an insight into the current system that Freeletics had been supplying with data up to that point:

  • Talend as ETL tool
  • Mainly batch based data processing
  • EC2 Linux machines as ETL hosts
  • Redshift databases as DWH
  • Data sources and their target formats in the DWH were identified.

Due to the rapid growth of Freeletics customers, to currently more than 42 million, and the resulting data volumes, this solution had reached its limits.

Building something new together – Designing something new

Based on the insights into the existing DWH and the predicted growth, the following requirements were determined:

What do you need? – The requirements

Non-functional requirements

  • Events are provided via HTTP
  • More than 100 events per second must be processed
  • Data processing almost in real time
  • A central database will store Freeletics user data including nested attributes
  • Events should be enriched with user attributes from the database
  • The application should be scalable, reliable, expandable and easy to maintain
  • AWS as a cloud provider
  • The operation of the infrastructure should be performed mostly independently by the Data Engineering Team
  • The data storage is to take place on an S3 DataLake
  • Python as primary programming language
  • PySpark for processing large amounts of data

Functional requirements

  • The Data Analytics team should be able to perform more complex analyses with Spark by accessing raw data
  • Teams from product development to finance should have the possibility to independently create generic but complex analyses and simple visualizations

How do we get there? – The new architecture

Data storage of user data and their attributes

Due to high read and write accesses and a large number of attributes, including nested attributes, we decided to use a DynamoDB as data storage for Freeletics users.
The fast response time and scalability of DynamoDB were also decisive factors for this choice.

Event processing

Data is received via an API gateway and processed by Lambda functions.
Processing means the enrichment of events by user attributes (stored in the DynamoDB) as well as GDPR-compliant masking of sensitive data such as IP addresses, email addresses, etc.

A general problem with event-based processing is error handling. Something usually goes wrong, no matter how stable the systems are designed. 🙂

If events are faulty, our software has errors. If a target system is temporarily unavailable, an event cannot be processed successfully at that moment. AWS offers SQS dead-letter queues. for this kind of problems.

Source: https://de.wikipedia.org/wiki/Notfallspur_(Gef%C3%A4lle)#/media/Datei:HGG-Zirlerbergstra%C3%9Fe-Notweg.JPG


If an error occurs during processing, incorrect events are moved to an SQS. Monitoring the queues with a subsequent reprocessing function allows you to process incorrect events again without losing them.

Data management of the events

Events are stored in S3 partitioned by event type/YYYY/MM/DD. The storing was done in the Lambda functions mentioned before.

A downstream DataBricks job ensures that individual events are combined into parquet files. This allows a faster and more cost-effective access to the data.

More Data

Ad Spend data was loaded daily via classic Python Batch Jobs via an API, or in the case of larger amounts of data, such as CRM data, processed via Spark Jobs. The resulting data was also provided to the S3 DataLake.

Data Access

For the Data Analytics Team

The individual events in DataLake or the events aggregated by DataBricks can be accessed by Spark, which also allows for the efficient analysis of large amounts of data.

For teams from product development to finance

Freeletics decided on the “Amplitude” tool to make data accessible to product managers*, for example. For this purpose, events were transferred to Amplitude by forwarding them to an “export” lambda. Evaluations can thus be carried out almost in real time. Identifiers between the different event types allow complex evaluations for product development and controlling.

Hand in hand for data – Implementing together

We implemented the previously planned system together with Freeletics’ data engineering team.

After a development time of about 8 months, all required functionalities were implemented in the new system and available for the users. The old DWH could be shut down

Afterwards the Data Engineering Team of Freeletics took over the operation, maintenance and further development of the system completely. FELD M supports the team until today, July 2020.

A bright future – A conciliatory outlook

As developers* we should not be put off or even intimidated by what one of my best friends likes to describe as “technology bombshells”. Extensive experience with and a deep understanding of technology allows us to develop good applications – be it in Azure, AWS, on-premise or any other environment.

After all, our applications are still based on the good old protocols such as TCP, UDP or HTTP.